Description
Sound Analyzer is an application for analyzing audio signals using only a mobile device.
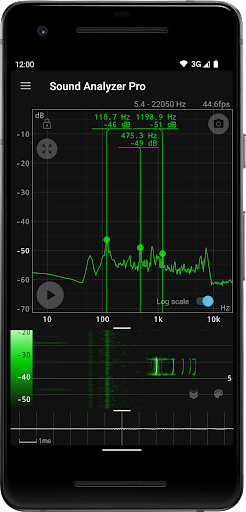
Its main function is to display frequency (Hz) and amplitude (dB) spectra in real time, but it can also be used to display changes in spectra over time (waterfall view) and to display waveforms (waveform view) at the same time.
The frequency measurement accuracy of the Sound Analyzer is very high, and in a relatively low-noise environment, the measurement error is generally within 0.1 Hz. (when measured with default settings)
Main Functions
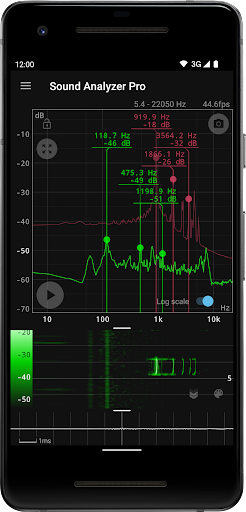
- Peak frequency display function (displays the frequency [Hz] and amplitude [dB] of prominent spectral components in real time)
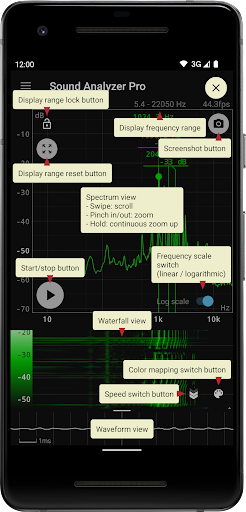
- Change of display range by touch operation
- Switchable frequency axis scale between logarithmic and linear scale
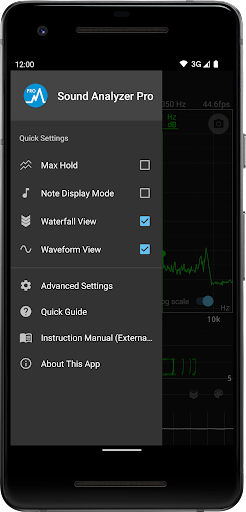
- Max hold function
- Waterfall view (displays spectral changes over time)
- Waveform view (displays sound waveforms)
- Note display mode (displays pitch in terms of A to G♯ note names and error [cents])
- Screenshot function (with timer)
- No advertisements
About High Frequency Spectrum
The app allows the highest frequency setting to be raised to 96 kHz, but settings above 22.05 kHz are primarily for high-performance devices, not for general-purpose devices.
In most devices on the market today, data in the high frequency range above about 22 kHz is filtered out. Since it is not possible to acquire data in the removed range even with a higher setting value, it is normal for the spectrum in this range to contain only weak noise of less than -60 dB.
However, depending on the model, larger noise due to filter processing may appear at certain frequencies such as 48 kHz and 96 kHz.
Tampilkan Lebih banyak
OTHERS:MUSIC_AND_AUDIO
Apa yang Baru di Versi 1.3.5
Terakhir diperbarui pada Jan 13,2025
Perbaikan bug kecil dan peningkatan. Instal atau perbarui ke versi terbaru untuk melihatnya!
Tampilkan sedikit
Tangkapan layar
Informasi
-
Diupdate2025-01-13
-
Versi Saat Ini1.14.0
-
Ukuran apk0MB
-
Membutuhkan AndroidAndroid 4.4+


